Objective
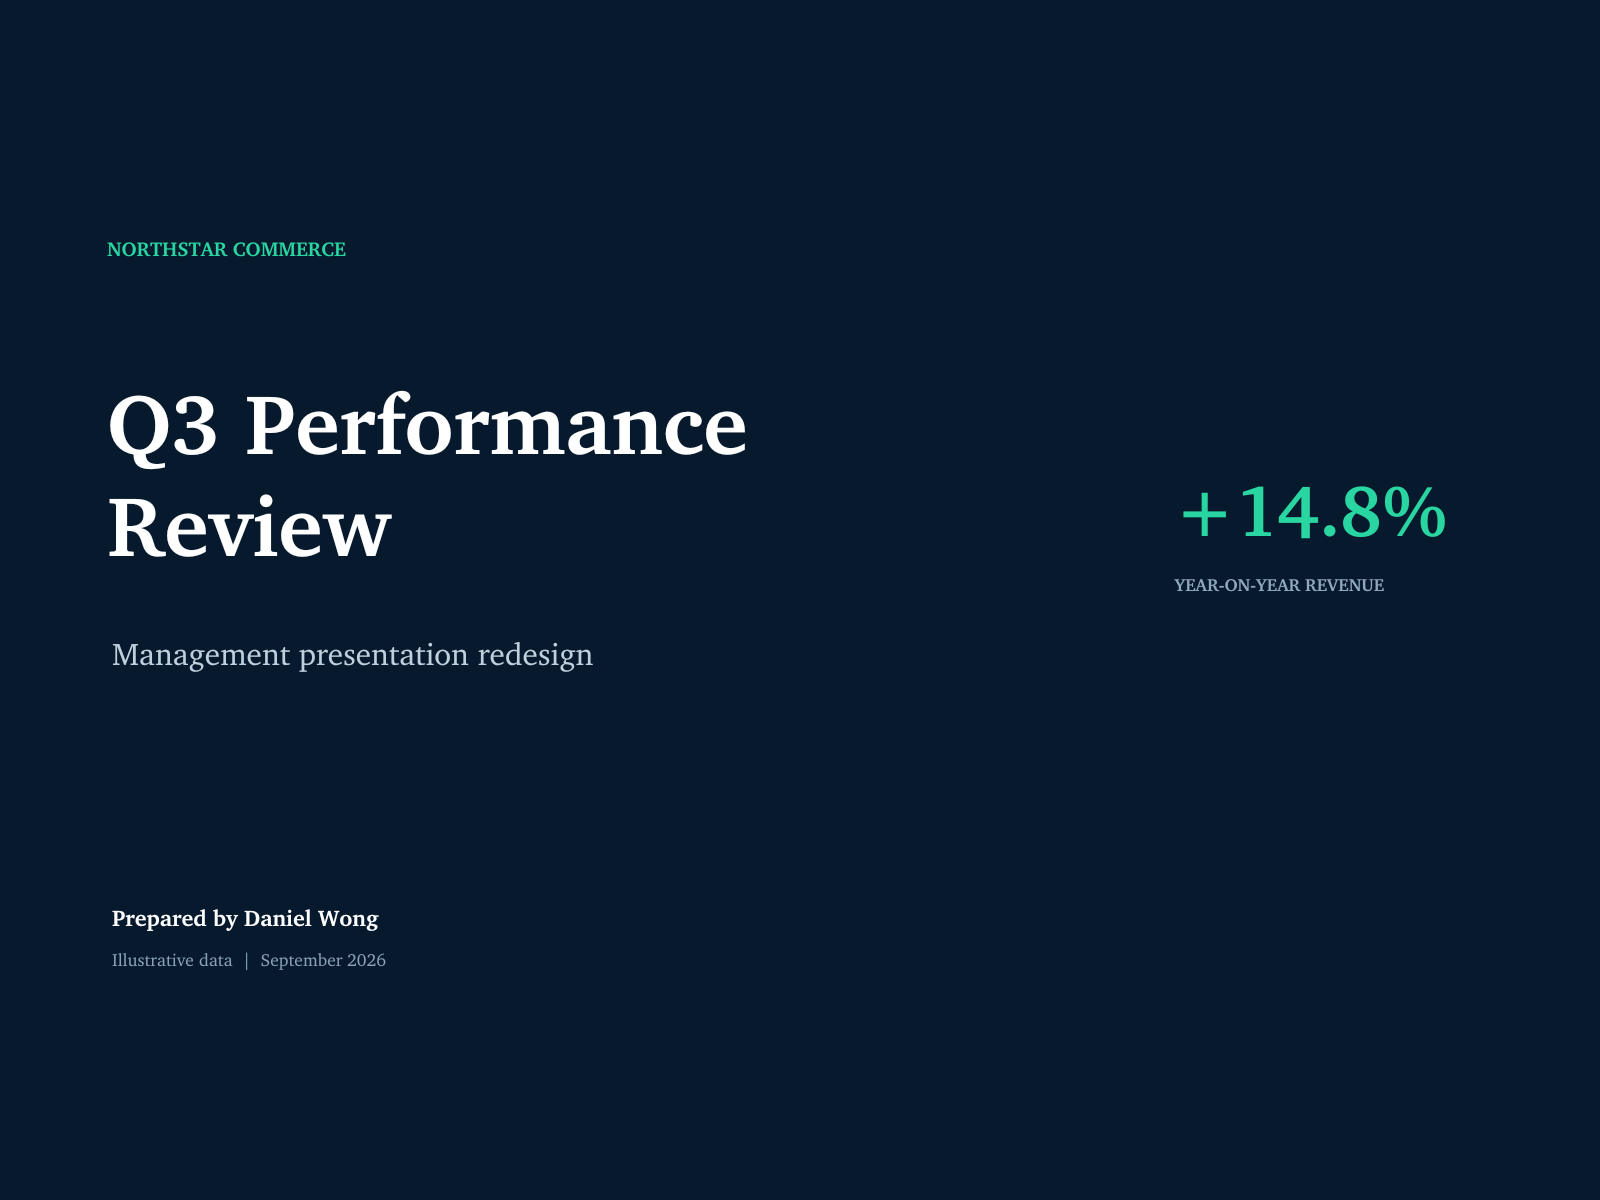
The project demonstrates how scattered management figures can become a short, decision-focused presentation for an executive audience.
Approach
- Organized the storyline around performance, regional growth and customer retention.
- Converted synthetic source figures into editable native PowerPoint charts.
- Used a consistent hierarchy so each slide communicates one main point.
- Finished with specific Q4 priorities linked to the analysis.
Outcome
The final deck provides a clear six-slide reporting structure that a business can update each quarter. Text, figures and charts remain editable for practical handover.