Objective
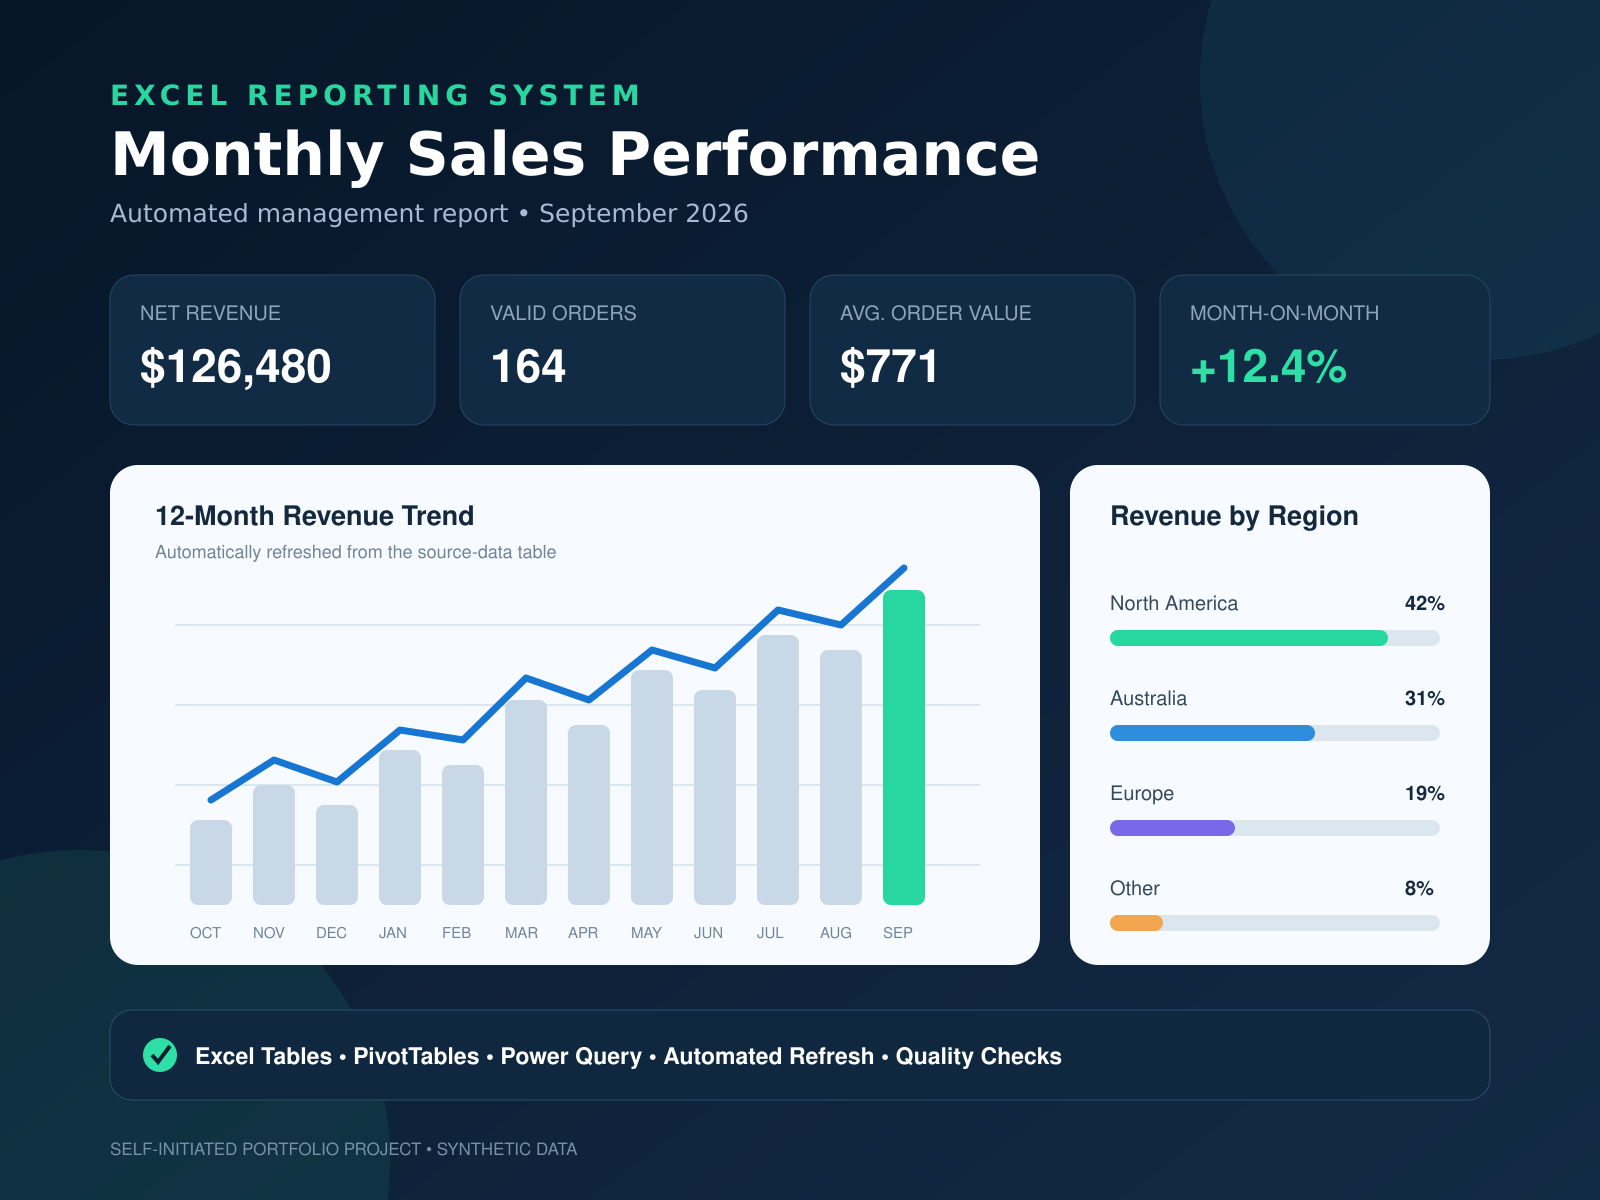
The goal was to create a management-ready report that could be updated each month without rebuilding charts or manually rewriting KPI summaries.
Approach
- Structured transaction data as an Excel Table.
- Applied quality checks before records entered the reporting layer.
- Created PivotTable summaries for revenue, orders and average order value.
- Presented a rolling 12-month trend and regional contribution in one view.
Outcome
The design supports a simple update cycle: append the latest source data, refresh the summaries and review the latest KPIs. The layout keeps operational detail separate from management reporting.